What is Microsoft Clarity?
420
06/08/2025
Clarity is a free analytic tool developed by Microsoft.
Key features;
- Heatmaps: Visualize areas of a website that receive the most attention through clicks, scrolls, and area heatmaps.
- Session Recording: Observe how users interact with the website, including mouse movements and clicks.
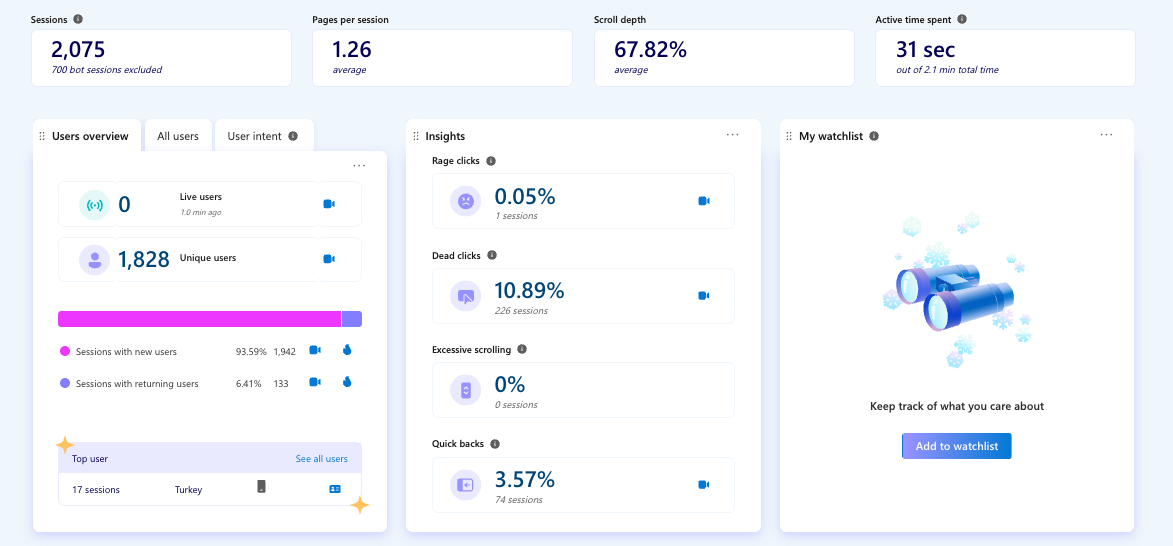
- Insights: Page clicks, sessions, live users, unique users, and more.
- Google Analytics Connection: Microsoft Clarity shows Google Analytics data records.
Clarity Heatmap Tool
Clarity website heatmap analytics tool is a platform that helps you visually analyze how users interact with your website. This tool tracks user behavior and displays it using heatmaps, which are color-coded overlays on your website pages.
Benefits of Microsoft Clarity Heatmap
- Improve user experience (UX) by spotting friction points.
- Enhance conversions by refining call-to-action (CTA) elements and layouts.
- Test design changes and see how users respond.
- Understand drop-off points on landing or sales pages.
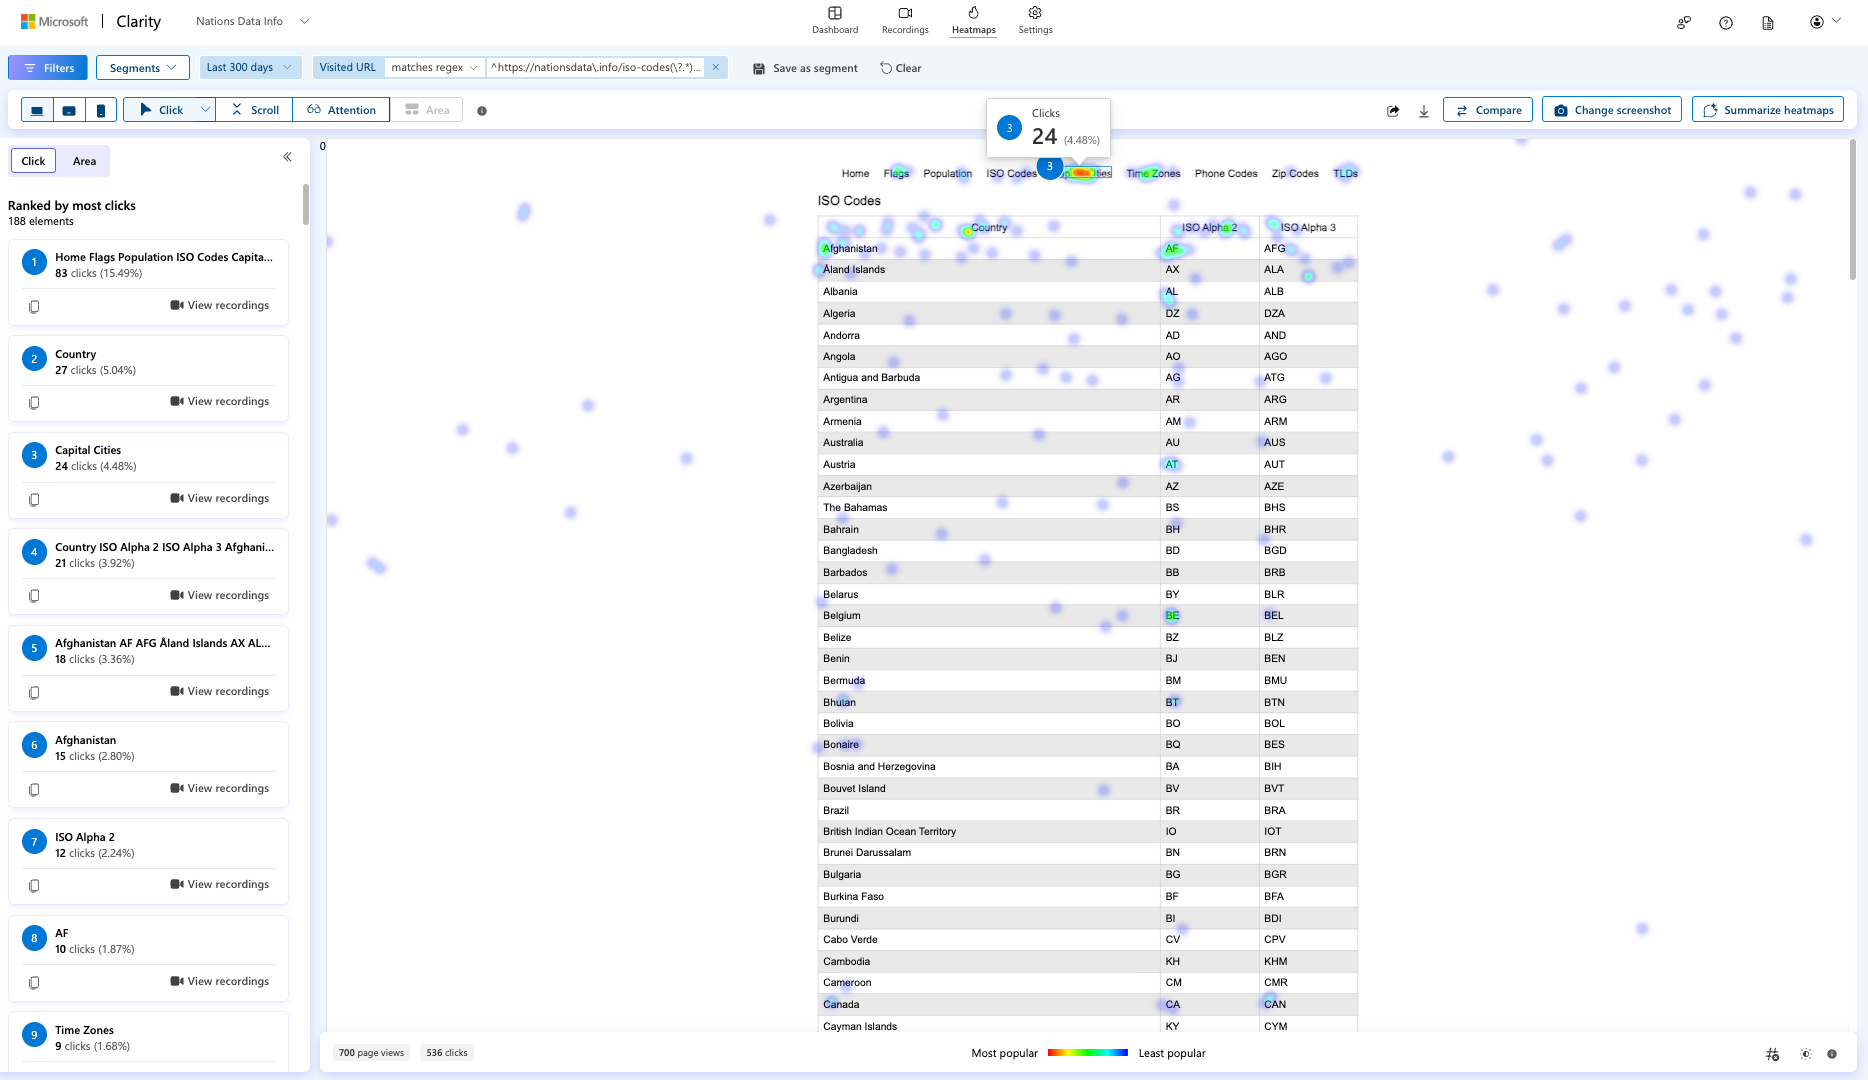
Click Heatmap
To discover which parts get more clicks on a page.
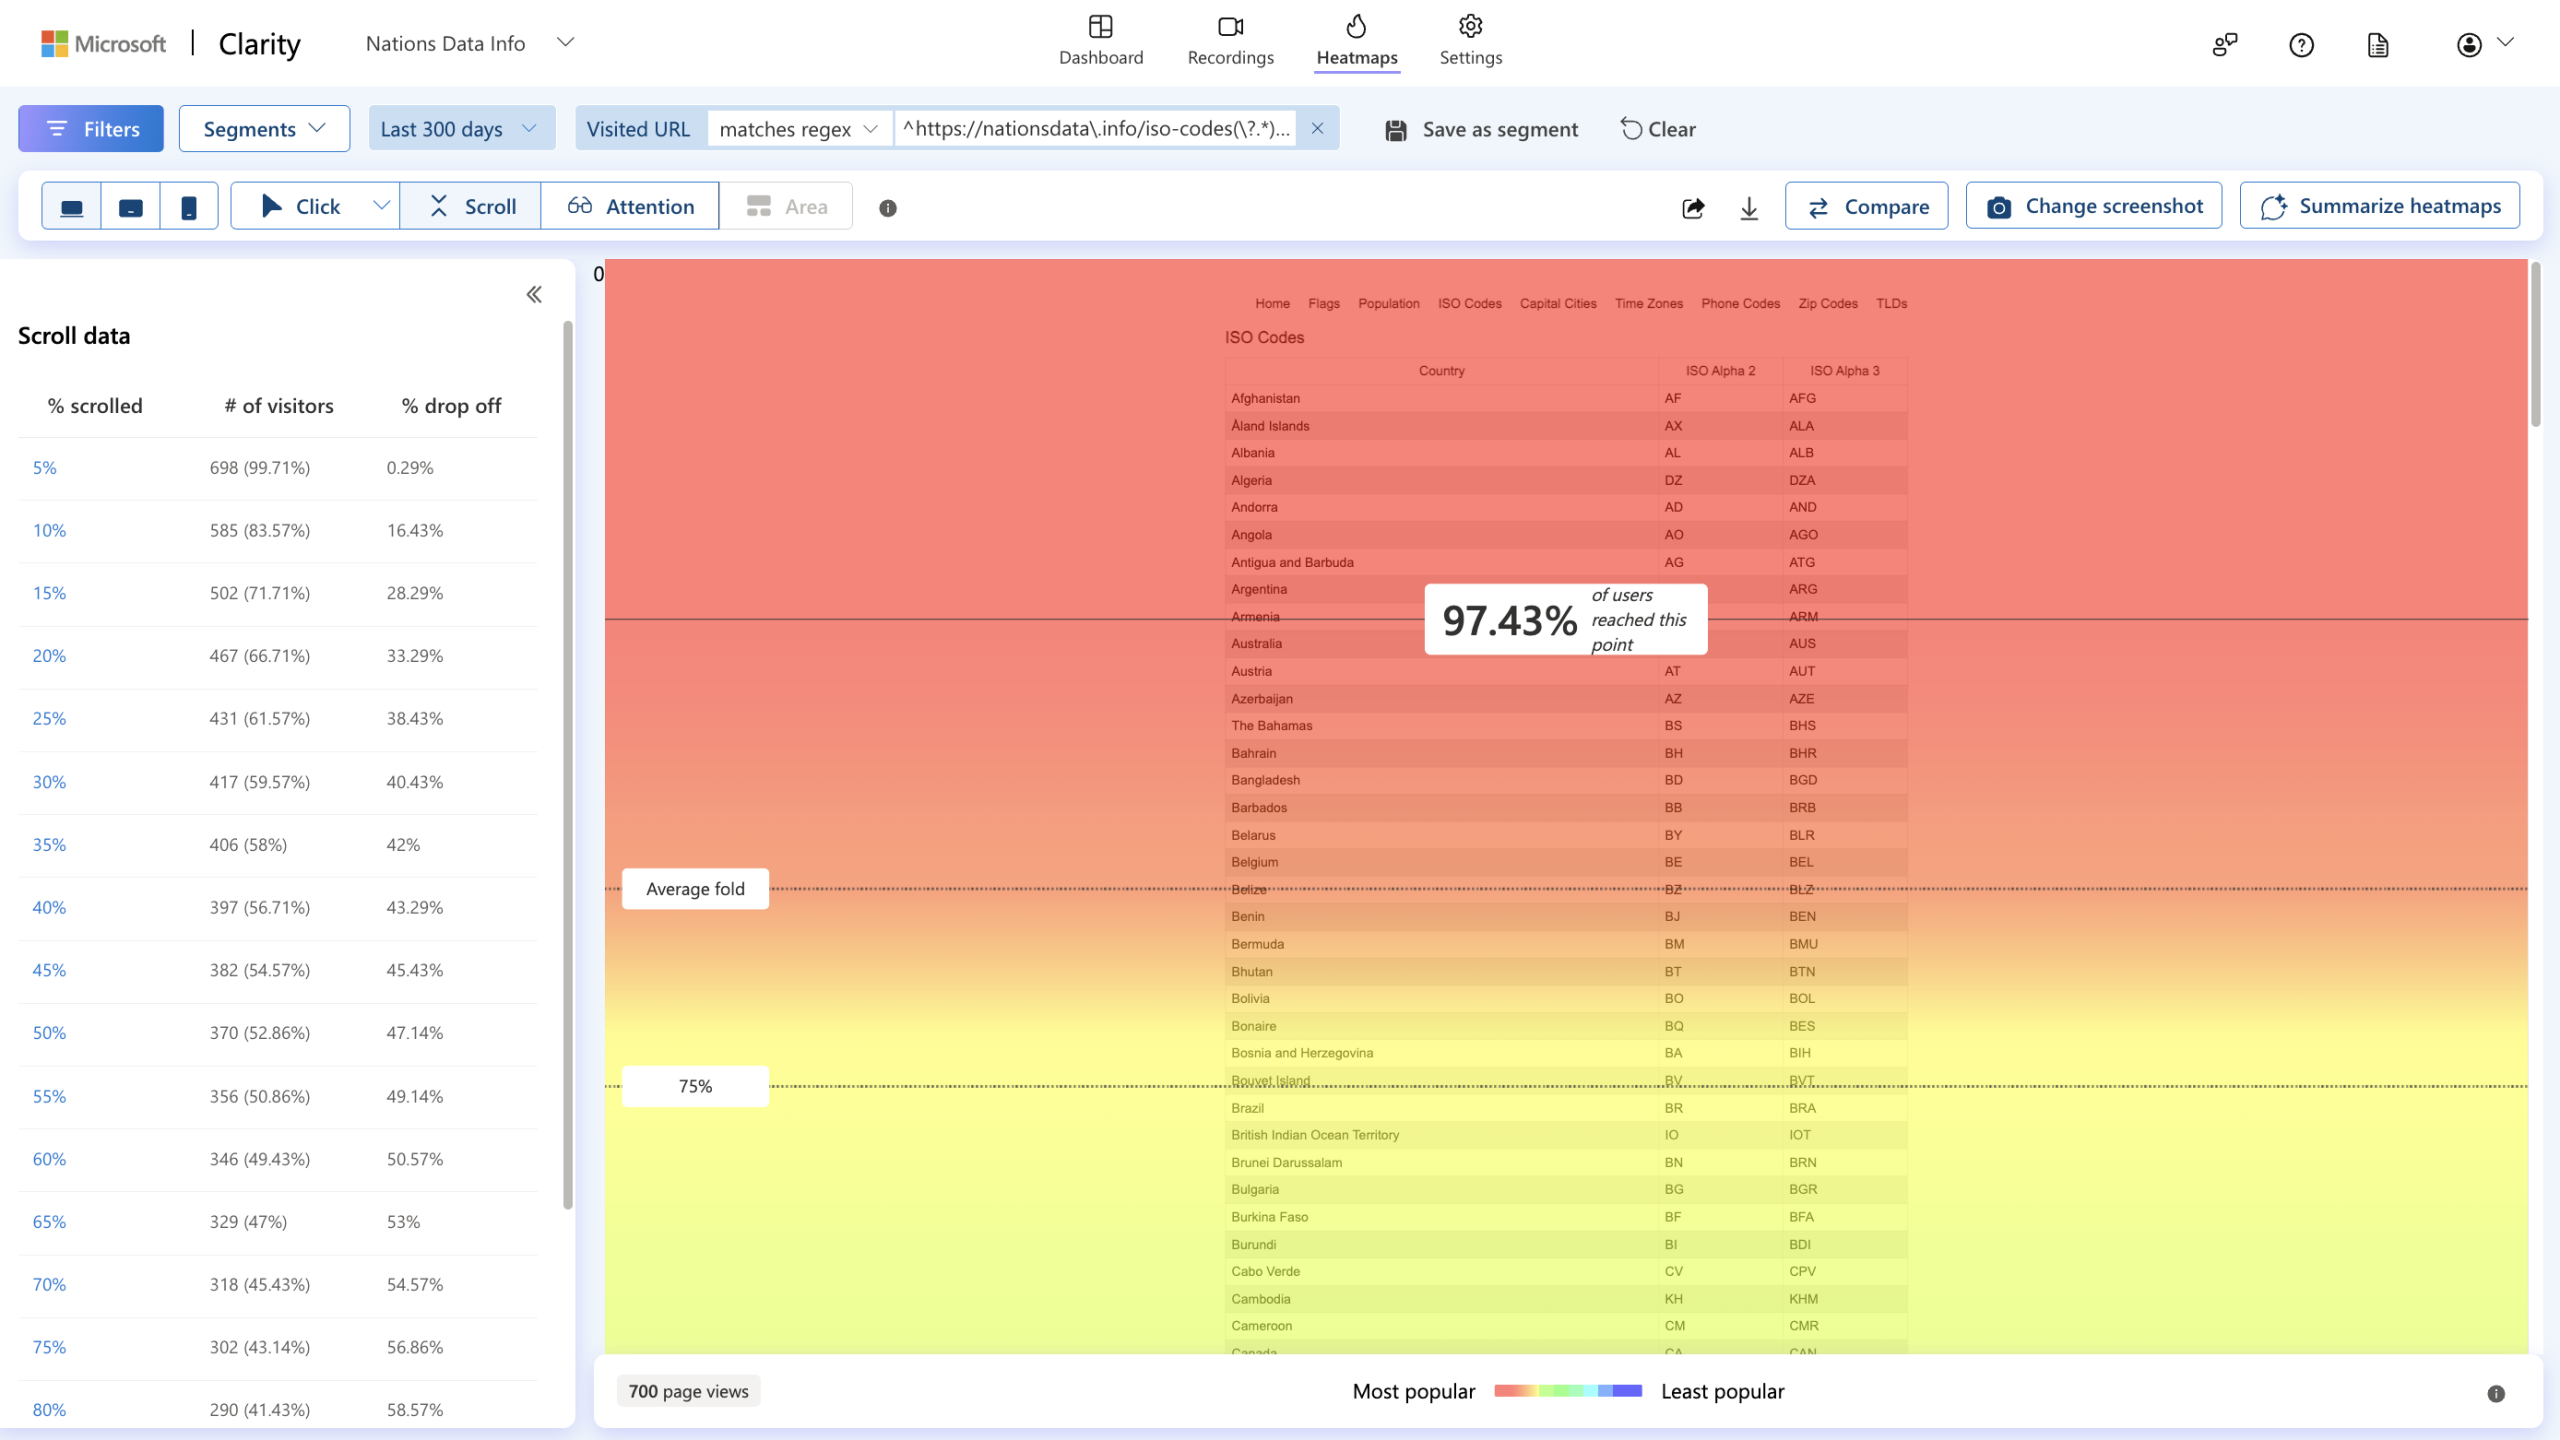
Scroll Heatmap
This heatmap type shows how far users scroll down and what they miss.
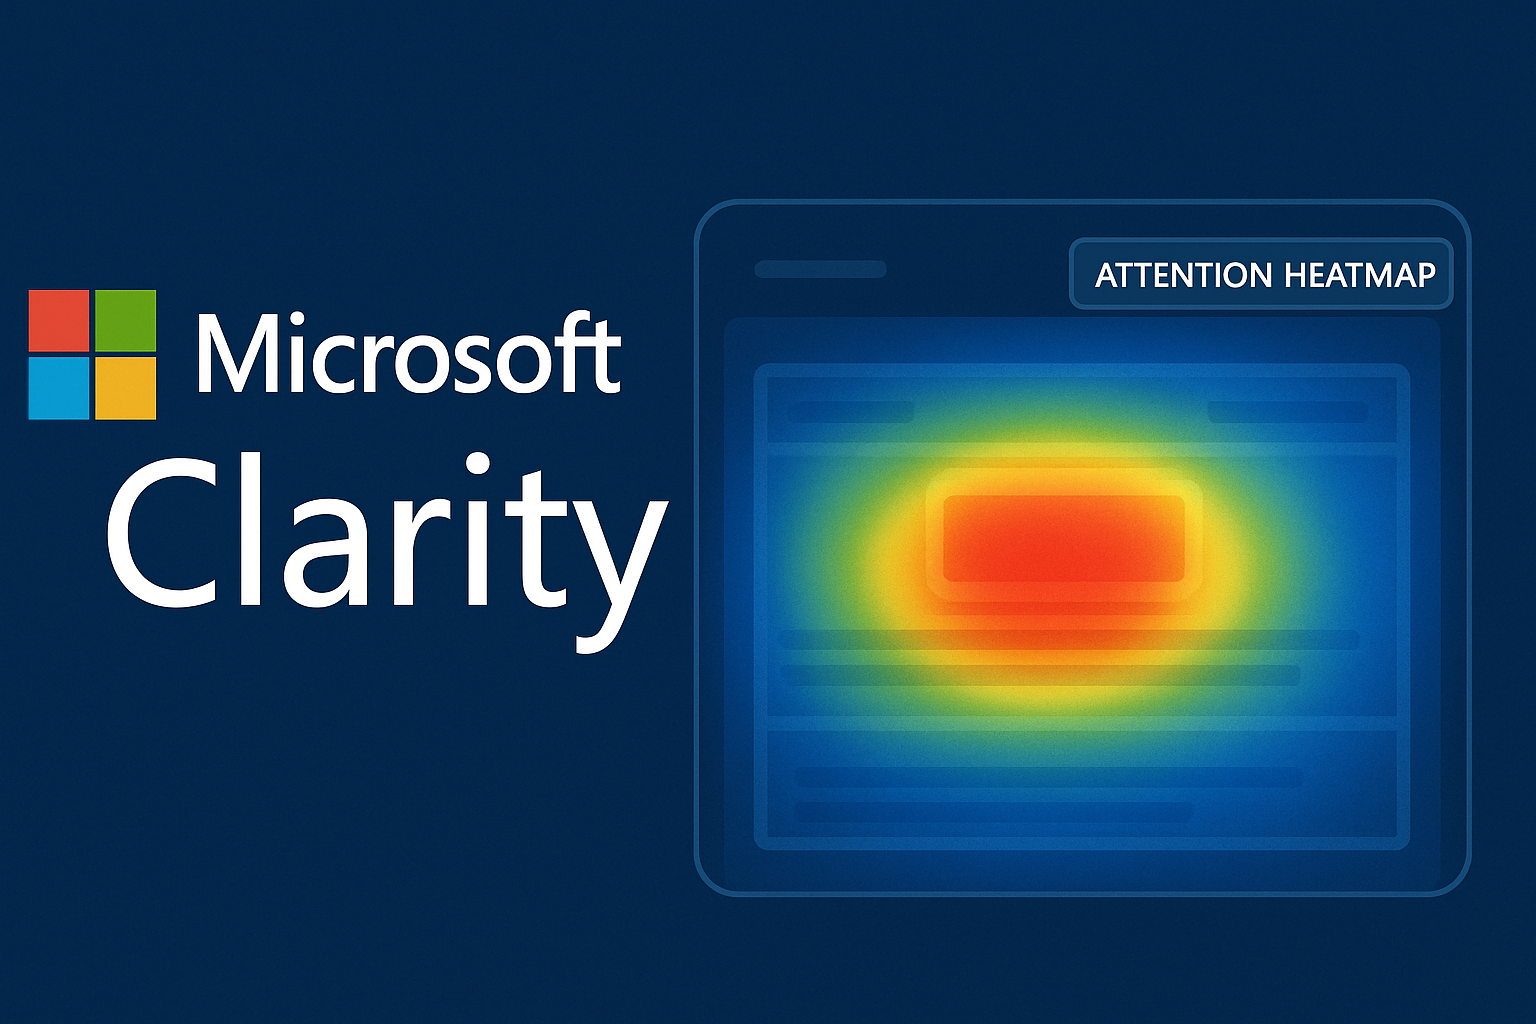
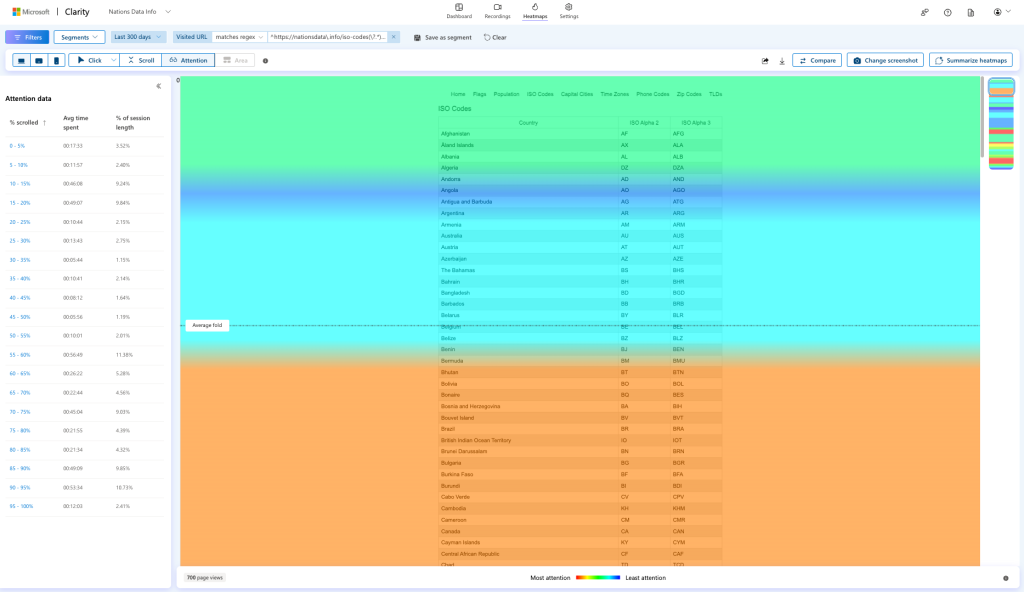
Attention Heatmap
An Attention Map visualizes the parts of a web page where users spend the most time, using color-coded overlays. Warm colors indicate longer viewing times, cooler ones indicate less attention.
Insights
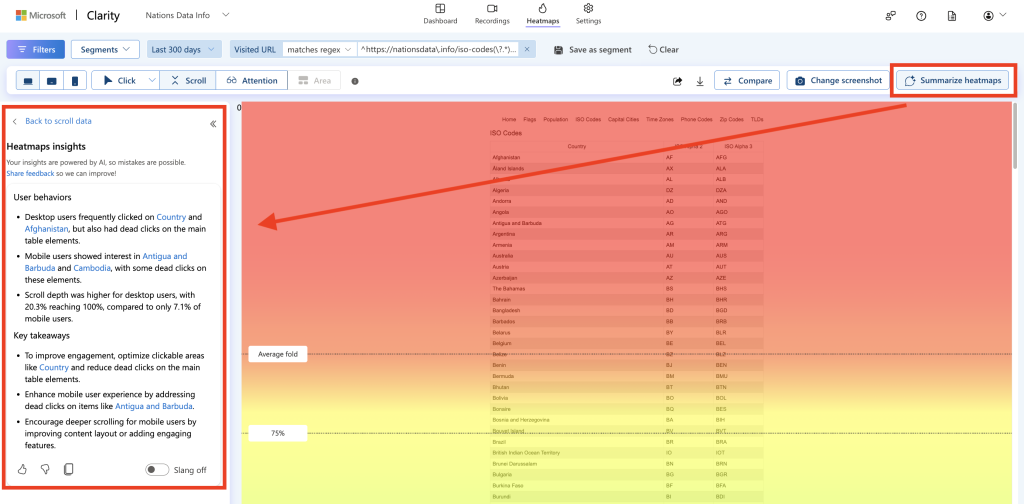
Clarity AI Summarize
Clarity uses AI to summarize report data and share insights with users.
Advertisement
Continue Reading Below
Related SEO Topics